






GNSS accuracy is deceptively simple to describe and remarkably difficult to measure. A GNSS receiver can generate highly accurate measurements in open sky, yet behave very differently in an urban street flanked by tall buildings, or beneath dense foliage, where signal reflections and obstructions degrade performance. To correctly measure the accuracy of a receiver requires comparison to an even more accurate “ground truth” reference. Establishing a reliable ground truth in challenging conditions is more than half the battle when testing GNSS receivers, particularly since almost all practical ground truth systems rely on GNSS to provide an absolute positioning reference.
FocalPoint’s core innovation, Supercorrelation®, is aimed primarily at improving the accuracy of GNSS measurements in difficult signal environments. This patented signal processing technology works by enabling long (typically 1 second) coherent integration of signals while compensating for antenna motion. The result is improved sensitivity towards the line-of-sight (LOS) signals coming directly from the satellites, along with simultaneous suppression of multipath interference and reflections.
GNSS performance testing is therefore central to what we do. We test for two main reasons. The first is to demonstrate the performance benefits of our technology: potential adopters of our product need verifiable evidence that the improvements we describe are real and reproducible. The second is to drive continuous product development: testing tells us what works, what doesn’t work, and where edge cases warrant engineering attention. Feedback from customers and users all inform the next iteration, closing the loop between what we measure and what we build.
This article describes how we approach performance testing for our Supercorrelation technology and our on-chip automotive software product, S-GNSS® Auto: why we test the way we do, what we actually measure, how we design trials and collect data, and the analytical methods we apply to draw meaningful conclusions. Our goal is to understand our technology deeply, to determine where performance limits lie, and to support our customers with evidence they can trust.
What we measure
Evaluating a GNSS receiver purely on position error — how far the reported location deviates from the true location — is necessary but insufficient for understanding Supercorrelation’s contribution. Position output is the end product of a complex data processing chain; in order to understand why performance improves, we need to examine the chain at an earlier stage.
We therefore evaluate performance across two complementary domains.
Measurement domain accuracy captures errors in the raw observables that feed the positioning engine: pseudorange (code phase), pseudorange rate (Doppler), and accumulated delta range (ADR, or carrier phase, for high precision positioning systems). It is in the measurement domain that the benefits of Supercorrelation are first realised; that is, in the improved accuracy of these raw observables stemming from strong, interference-free reception of LOS signals. Downstream, a cleaner pseudorange and Doppler leads to reduced position error; a multipath-free ADR observable enables stable carrier-phase positioning where a conventional receiver would lose lock or suffer a cycle slip. Deep analysis of measurement domain errors is somewhat unusual among GNSS receiver evaluations, but it is essential for FocalPoint. By quantifying measurement domain improvements, we can trace the causal chain from signal processing enhancement all the way through to the position solution that an end user sees.
Position domain accuracy measures the final output: the three-dimensional position and velocity errors. This is ultimately what matters to the operator of a vehicle, a robotic mower or a precision agriculture system. We evaluate both position and velocity accuracy, reflecting the fact that many applications depend on reliable speed and heading outputs as well as accurate location.
Critically, we focus our evaluation on the environments where the benefits of Supercorrelation are most pronounced and most consequential: deep urban canyons, under foliage, beneath stacked highway structures, and in any scenario dominated by multipath and reflected signals. This is where conventional GNSS signal processing breaks down and where the engineering challenge is most severe. Open-sky testing, such as on highways, provides a performance baseline, and ensures that the gains delivered in the hardest environments never come at the expense of performance in nominal conditions.
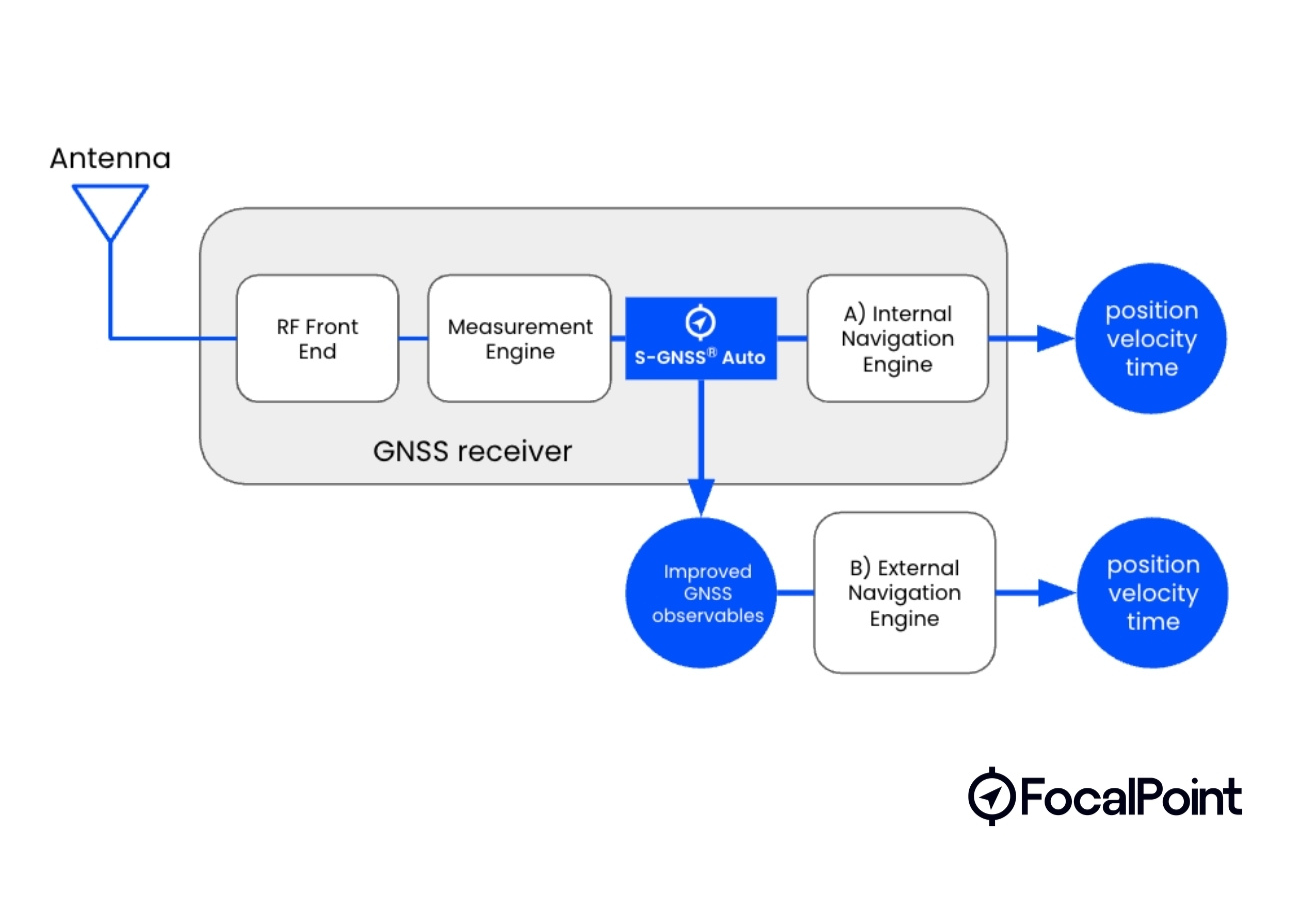
S-GNSS Auto is applied as a firmware upgrade to the measurement engine, passing on improved GNSS observables to the navigation engine (internal or external).
How We Design Trials
Our testing spans a deliberate range of scenarios and draws on two complementary data sources.
Real-world data collection
Geographically, we conduct trials and data collection campaigns across multiple regions — including the United States, Europe and Asia — to capture the variety of urban architectures, building materials, road layouts and satellite geometries that real deployments encounter. Environmentally, we test in open sky (as a baseline), deep urban, heavy foliage and complex mixed environments including multi-level road structures. We exercise multiple GNSS constellations: GPS, Galileo, BeiDou and QZSS, across multiple frequency bands (L1, L2, L5) and signal types, including both data and pilot channels.
Our testing also compares S-GNSS receiver outputs against commercial state-of-the-art GNSS receivers. We use a variety of reference receivers from different manufacturers and featuring a range of capabilities; for example, some capable of performing precise GNSS positioning using live correction services, others featuring integrated inertial sensors. This ensures we are benchmarking our technology using genuinely competitive baselines.




A sample of the environments and locations we test in. Deep urban (downtown San Francisco), © Ross van der Merwe. Underpass (Bay Bridge, California), forest roads (Black Forest, Germany) and dense urban areas (Teheran-ro, Seoul); © Laurence Bennett.
Establishing ground truth is the single most challenging aspect of real-world GNSS evaluation. To evaluate a receiver’s measurement and position domain errors, you need to know the truth it is being compared against, and in a deep urban canyon or under dense canopy achieving centimetre-level ground truth is non-trivial. We address this by employing tightly coupled GNSS/INS reference systems — high-grade inertial measurement units coupled with dual-antenna GNSS receivers — supported by sophisticated post-processing software which can provide reliable, high-accuracy reference trajectories even when signal conditions are severely degraded. The quality and reliability of the ground truth is as important as the measurements themselves; a poorly defined reference corrupts every downstream comparison.
Synthetic data generation
Synthetic GNSS signal generation forms a key part of our software development and testing set up. Particularly useful where real-world collection is impractical — for example, for early-stage algorithm development, or stress testing of edge case conditions that are difficult to replicate on demand — advanced simulation tools allow us to define fully known ground truth and generate realistic signal environments under controlled conditions.
With perfect understanding of the synthetic ground truth we can make highly accurate and precise measurements of receiver performance, at both the system and individual component levels. The important caveat is fidelity: no simulator can perfectly reproduce real-world conditions, and synthetic test results must always be validated against live trials to confirm real-world performance.
Analysis: Statistical and Causal
Our analytical framework has two layers that are equally important and mutually informing.
Statistical analysis provides a broad view of performance. We aggregate outputs from individual trials and across sets of trials to produce cumulative distribution functions (CDFs) of the measurement and position domain errors.
Error CDFs allow us to characterise receiver accuracy at any desired percentile: the 50th percentile (median), the 95th percentile (the most commonly cited accuracy metric for positioning systems), and the tail behaviour at the 99th percentile and beyond. We can further split these data into different categories to produce multiple CDFs, for example focussing on specific environments, GNSS signals, frequency bands and constellations, to provide a deeper understanding of performance and inform future development.
We compare our S-GNSS error CDFs directly against conventional receiver outputs, providing a statistically robust picture of accuracy improvements. Because GNSS signal processing is inherently stochastic, we also perform repeated replays of the same captured data through the full receiver hardware and software stack to characterise variability in the results themselves.
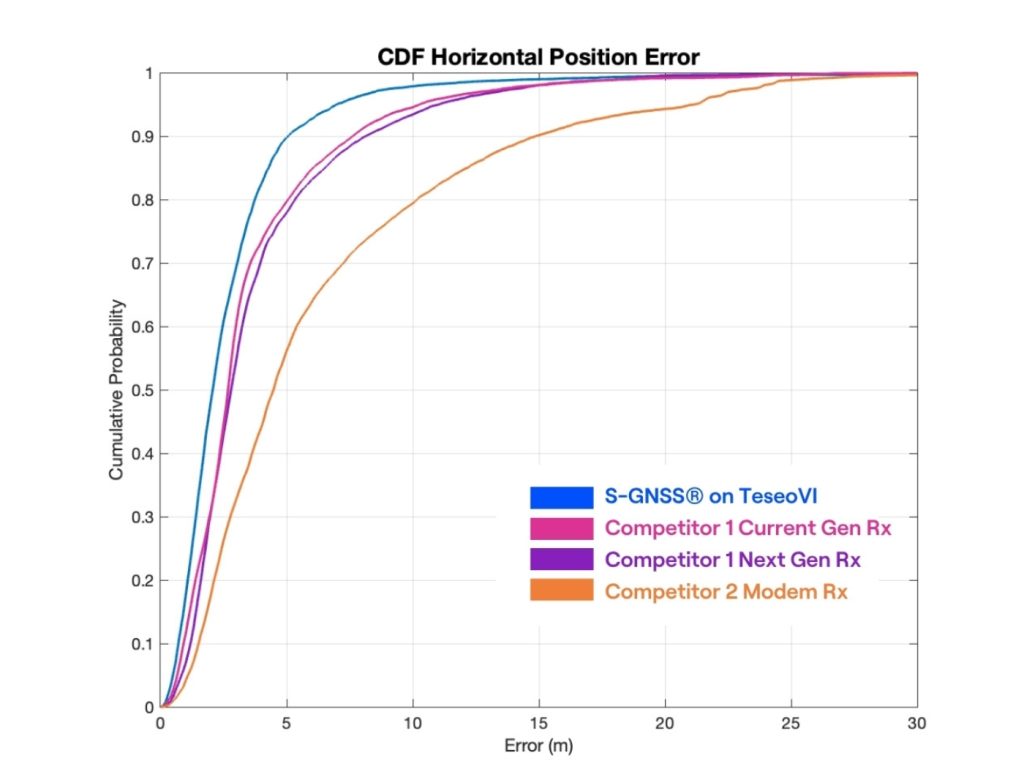
Example of a cumulative distribution functions (CDF) plot
Causal analysis goes deeper. Statistical summaries are powerful, but alone they cannot explain how and why system changes lead to a given effect. And in some cases they can obscure the events that matter most, particularly for safety-critical applications.
Causal analysis is aimed at providing deeper understanding of our S-GNSS algorithms and interactions with the wider system — hardware, firmware and input data. It is particularly powerful when targeting specific, potentially low frequency events and edge cases, such as transitions between environments.
For example, a receiver that performs well across 99% of an urban test route might show degraded performance at a few specific locations or times. These low frequency events, which contribute to the tails of the error distributions, can represent failure modes with significant application consequences. By examining signal-level data, correlating errors with environmental features, and understanding the causal chain from input to output, our engineering team can identify the cause of even rare, isolated events and address the underlying issues.
This dual approach reflects a broader commitment: we apply all the tools available to us to provide a comprehensive view of performance, guided by what our customers need. The result is improved performance, reliability and robustness for our product.
Conclusion
Building trust in GNSS performance data requires a testing methodology that is transparent, repeatable, comparative and analytically complete. At FocalPoint, that means evaluating both the measurements our technology produces and the positions it delivers; testing across the full range of environments and geographies our customers operate in; establishing rigorous ground truth against which all results are measured; and analysing our data both statistically and causally to gain a complete understanding of performance.
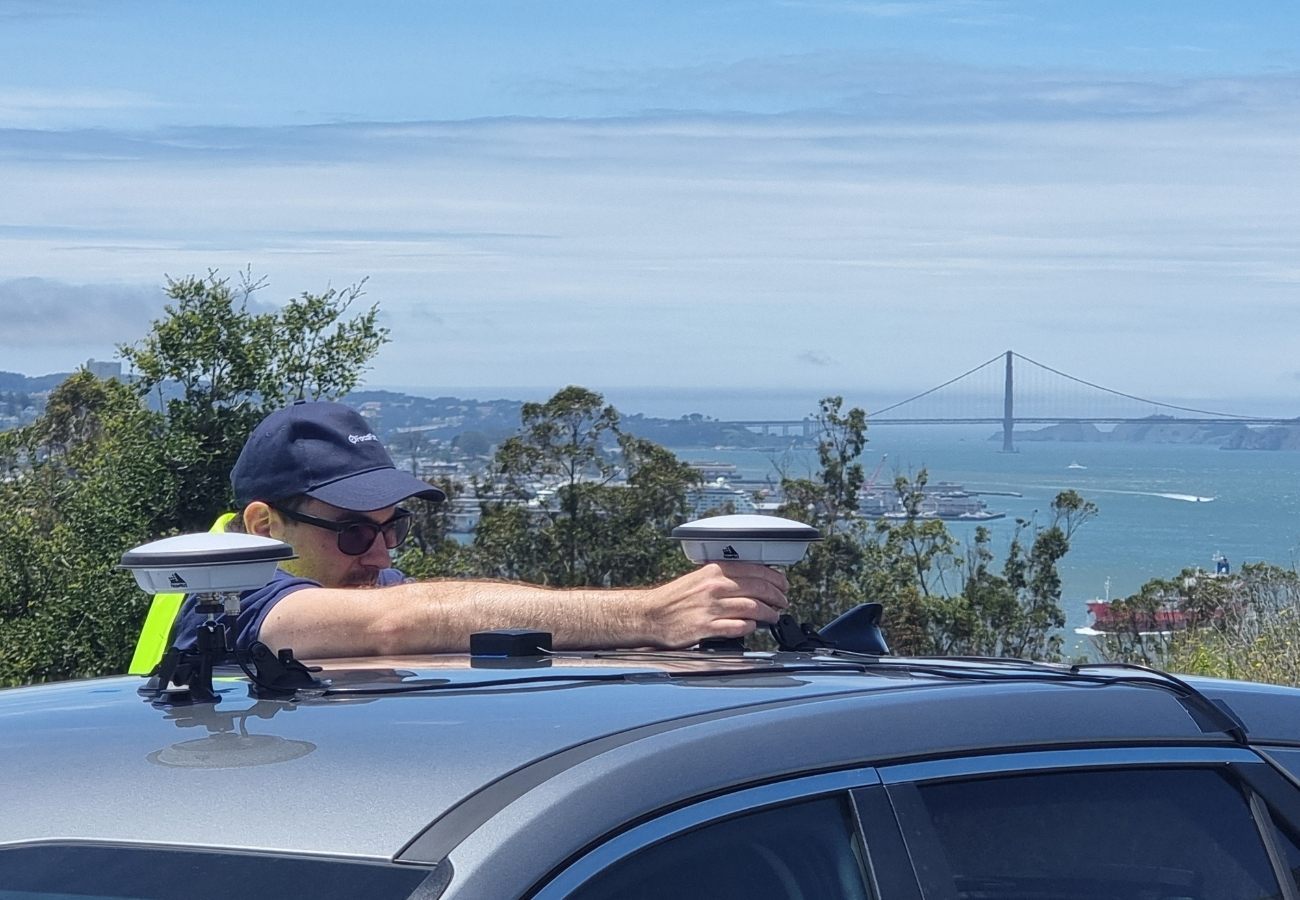
Cover pic: Ross van der Merwe setting up the test vehicle at San Francisco, © Laurence Bennett.
Evaluation kits with S-GNSS® Auto running on STMicroelectronics Teseo V and Teseo VI are now available. Request one here.
Share this post

Mark is the Head of Research and Development & IP at Focal Point Positioning. He holds a degree in Physics and a PhD in Astrophysics, both from Queen's University Belfast. He is a Chartered Physicist and a Member of the Institute of Physics. Prior to joining Focal Point Positioning, Mark worked in industry as a Research Scientist, involved in the development of new technologies spanning the navigation, positioning and security domains.
Related post
Skyscan: Enabling spatial authentication of GNSS signals using a single antenna
How Skyscan uses Supercorrelation® and a single antenna to verify where GNSS signals come from, with real-world results from a meaconing scenario at Jammertest 2025.